Benchmarking Your Performance
How are you doing relative to your peers?
By Scott Wright, director of mergers and acquisitions
Business owners strive to get a leg up on competition while improving their bottom line. This concept holds true in all industries, but boy does it drive us in real estate. At REAL Trends, we’ve worked with thousands of brokerage firms over the years, and a critical question that nearly always comes to the surface from the savvy owners of these companies is “How are we doing relative to our peers?”
This recurring question motivated us to develop a tool, called REAL Trends Benchmark Report, to provide answers. The Benchmark Report is sourced from the financial data we get from our legions of valuation, mergers and acquisitions as well as business-planning clients.
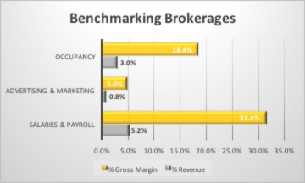 As you can see in the above table, we show where brokerage companies are with these expenses relative to their revenue and gross margin. This particular dataset is a national average from 2014 to current. As an example, of all the brokers we have financial data for (which includes all models from a graduated commission to cappers to fee based), the average firm spends 18.4 percent of gross margin, or 3 percent of revenue, on occupancy-related expenses.
Trim Expenses and Enhance Spending
Benchmarking can be incredibly useful in not only finding areas where you can trim expenses but where you can enhance spending that would ideally improve profitability. If your firm spends 26.2 percent of gross margin on occupancy-related expenses, then you may need to examine why there’s such a deviation from the norm. If your firm is spending only 18.1 percent of gross margin on salaries/payroll, then you can explore hiring a full-time transaction coordinator to help your sales associates.
Our benchmark report includes a myriad of valuable metrics. Above the line, we examine gross margin and percentage retained, and below the line, we look at expense categories like the ones in this table. We also look at agent productivity and break down the data on a per-office basis to normalize the report to fit brokerages of any size. Lastly and equally important to our clients, we segregate our data by region. Brokerage firms in the northeast do business differently than those in the south, so we need to make sure we compare apples to apples.
Benchmarking is something that can help all real estate brokerage firms in their quest to build value. If this is something that intrigues you, contact us today to find out about our valuation services which include custom benchmark reporting.
What is a Benchmark?
By definition benchmark, as a noun means “a standard or point of reference against which things may be compared or assessed.” As a verb, benchmark means “evaluate or check by comparison with a standard.”
We’ve found that real estate companies love benchmarking their performance against their peers, and our report has developed into a standard that provides them with an excellent point of reference.
Challenges
One of the biggest challenges of running a brokerage company is effectively managing operating expenses. Occupancy, advertising/marketing and salaries/payroll are key expense categories that all brokerage companies pay very close attention to, and our benchmark data on these categories can help brokers understand how they scrub up with their peers.
