Brokerage Performance by Region
How do you stack up against your peers?
By Scott Wright, manager of business analytics
 As the nation’s leading firm in providing valuation services for the residential real estate industry, REAL Trends is privy to a plethora of useful data, including financial statements that we use to create our invaluable and highly sought-after benchmark report. Countless brokers have told us just how useful it is to scrub their financials against that of their peers. Not only does it help them understand how they compare above the line with their margins, but also below the line with how they’re spending.
This benchmark report is continually updated so we can provide up-to-date metrics to our clients as well as keep an eye on various industry trends. One trend we keep a close eye on is gross margin, and we get granular on this metric by breaking it down regionally.
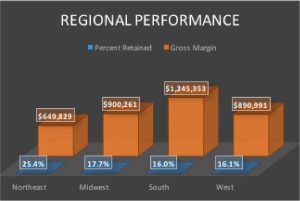
As you can see in this chart, there are some vast differences in how brokers operate in different parts of the country. The regions are broken out by the Northeast, Midwest, South and West. The chart displays the average gross margin (company dollar), and percent retained for each from 2014 to current. It’s important to note that these figures represent per office averages, a necessary standardization given the wide spectrum of sizes of brokerage companies for which we do work.
Gross margin, or company dollar, is simply a company’s top-line performance. It’s calculated by subtracting total commissions paid out to agents from total commissions earned. Percentage retained is then calculated by dividing gross margin by total commission earned. Simply put, the percentage of every dollar that a broker keeps after paying its agents. As all brokers know, this number has been trending down for several decades for various reasons, and as this chart shows, some parts of the country see it more than others.
Incredibly, in the South and West brokers are only keeping an average of 16 cents of every dollar of commission earned. In the Midwest, brokers are keeping only a tick higher, averaging nearly 18 cents. Yet, in the Northeast brokers are keeping 25 cents per dollar, a staggering 53 percent more than the average of the other three regions. How the heck are brokers retaining so much more in this part of the country? There are several reasons, but perhaps the farthest we need to look is the raw gross margin number.
In the Northeast, the average office generates a gross margin of $650,000, which is vastly lower than what the average office generates in other parts of the country. In the Midwest and West each office brings in about $900,000, with the South at more than $1.2 million! Northeast brokers may be keeping a bigger piece of the pie, but clearly, the average office isn’t as productive.
Interestingly, according to our benchmark data, the Northeast’s lagging per-office productivity goes beyond the gross margin. Net operating income in each of the other regions is materially higher, to the tune of 68 percent, 156 percent, and 42 percent in the Midwestern, Southern, and Western regions respectively. This lack of parity with the other regions may seem shocking, but it’s not all that surprising. Brokers in the Northeast tend to operate in a more traditional fashion, offering lower splits yet higher levels of support.
Take average agents per office as a form of validation. In the Northeast, this number is at 47, whereas, it is at 86, 147 and 69 in the Midwest, South and West respectively. What this tells us is desk space is more important in the Northeast. So, while the percentage of gross margin retained may be higher, brokers in the Northeast are likely paying more below the line in operating costs to support their agents.
There is certainly nothing wrong with the models the Northeast brokers are running, especially given the number of wildly profitable ones we see in this part of the country. More than anything, these inter-industry regional variances allow us to understand better the trends and norms, while also providing a reliable benchmark for brokers to consider.
